It's easy to criticize the spate of redistricting proposals that have come out at the state and local level recently: Why does Democrats April Sims' map make the 6th District more out of reach for Democrats? Why did Republican Joe Fain's map put Davenport and Browne's Addition in the same district? Why did Democrat Brady Walkinshaw's 27th district suddenly take a trip across the Tacoma Narrows Bridge? Why does Brian McClatchey's County Commissioner District 2 look so much like Abraham Lincoln in a Jacuzzi?
But it's one thing to be a critic. Truly understanding the challenge means donning the cartographer's robes yourself and trying to build your own map. So we did just that for this week's story on the Democrats' misfortunes in the 6th District, asking ourselves, "What would it look like for Democrats to have a better chance in the 6th?"


That's where "the Dave" comes in. Back in 2009, Seattle-based software engineer Dave Bradlee launched "Dave's Redistricting App," a free browser-based program that let you quickly change borders, all while keeping an eye on the population totals of each district.
The panel on the lower left side lets you switch between a color-coded view of every district and one that lets you see the partisan makeup of each district or even each precinct.
The panel on the lower left side lets you switch between a color-coded view of every district and one that lets you see the partisan makeup of each district or even each precinct.
It's exactly the tool that state and local redistricting committee members like McClatchey and Sims use to design the first draft of their own maps. So we tried our hand at it, to better understand why each commission-member drew the 6th — and other districts — the way they did.
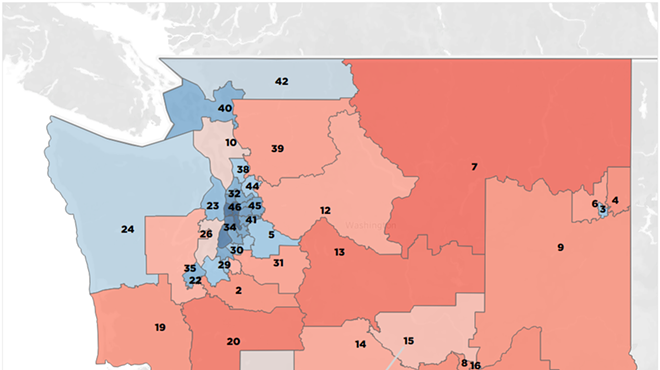
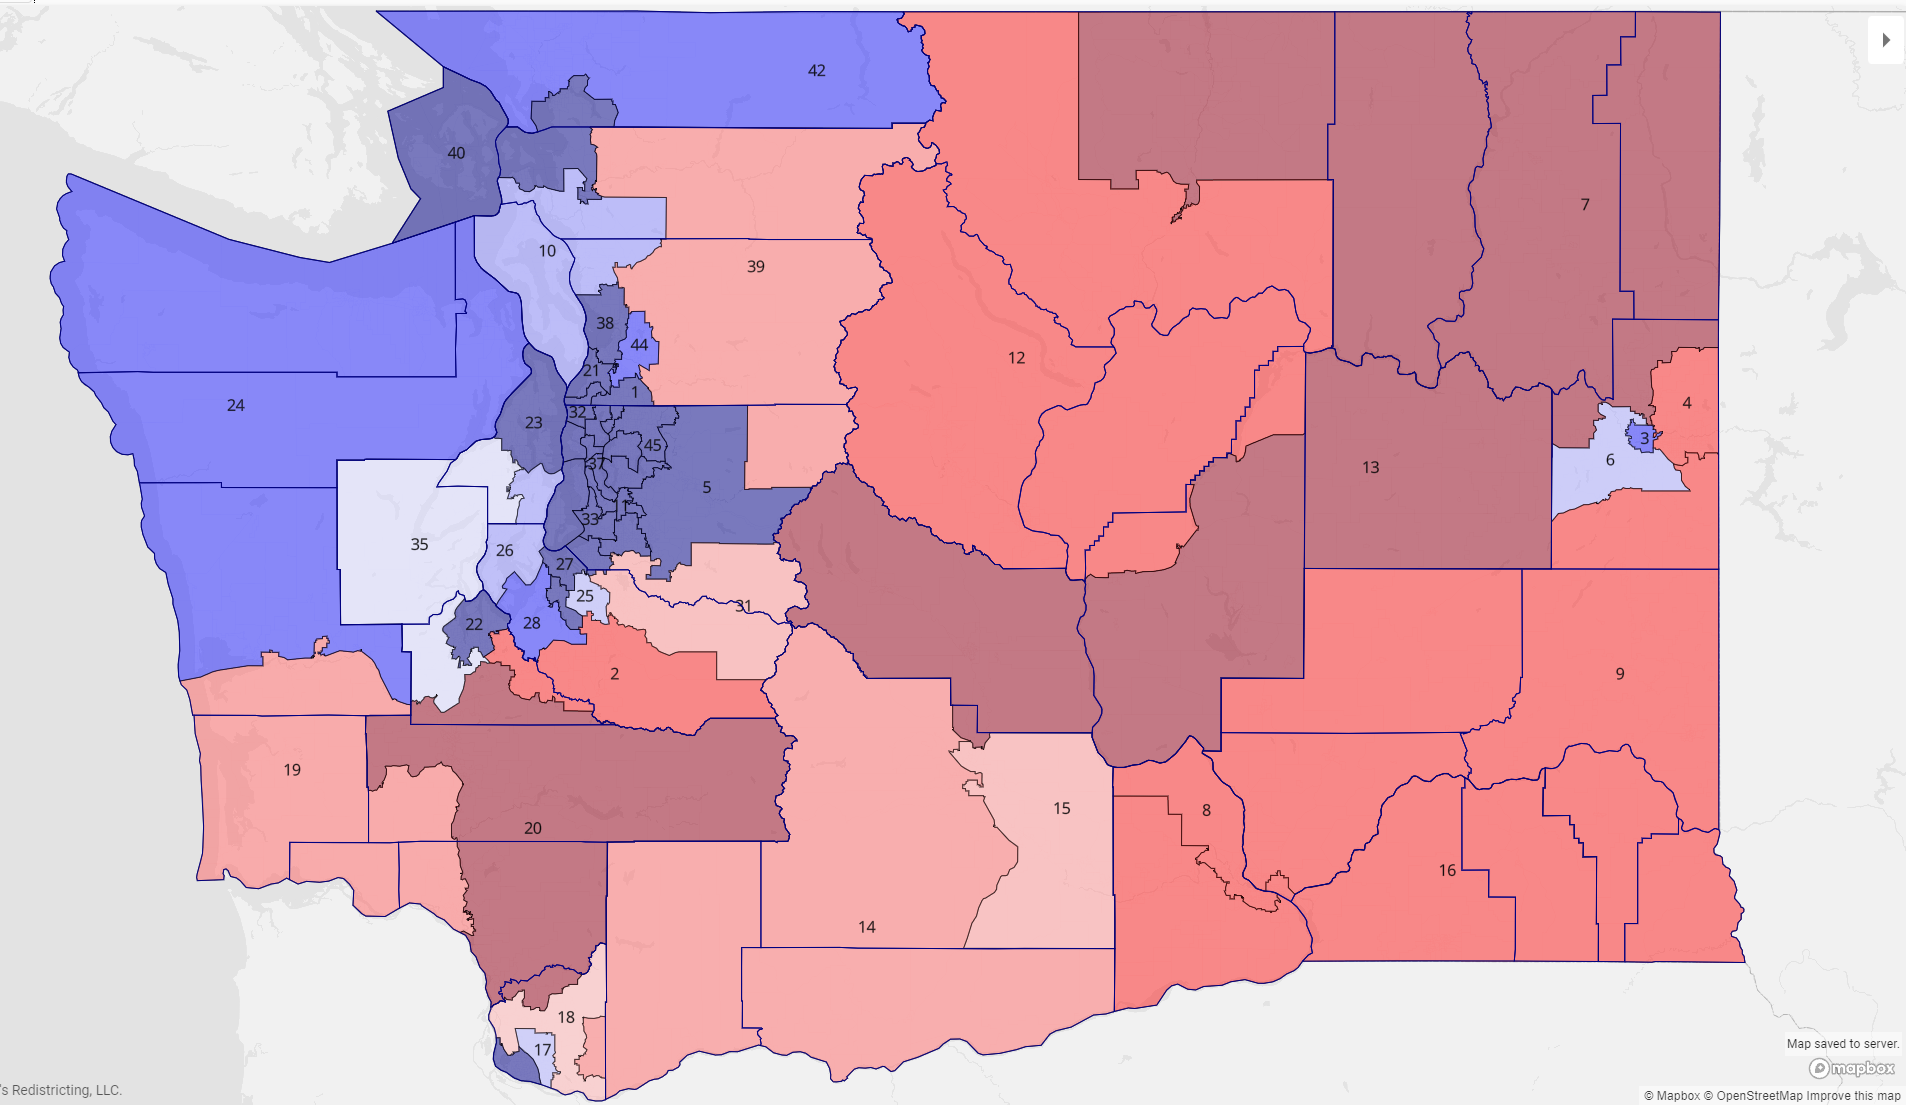
Here's what the state map looks like now:
Click here to see it on Dave's Redistricting App. We've had the app color the districts according to the Biden-Trump race, but you can change which race it uses to shade the map by clicking on the "settings" gear in the upper right corner. See the list of districts on the left? Look at District 3, and you immediately see a "-11,016." District 6, meanwhile, has a "2,205" next to it.
Finally, Washington state is one of only three states in the nation that make ensuring "political competition" an explicit part of their redistricting process.
But all of these competing duties tend to contradict the others: Focus on keeping communities of interest together, and you often make districts less competitive.
A few hours into simply trying to bring the populations roughly into alignment, we began to start contemplating doing crazy things like splitting Othello between three different districts. It's the only way!
And few hours after that, it was like the map began talking to us, whispering dark and terrifying secrets.
But mostly we concentrated on experimenting with the 3rd and the 6th. Here's what state Democrats came up with: Here's what the state map looks like now:
Click here to see it on Dave's Redistricting App. We've had the app color the districts according to the Biden-Trump race, but you can change which race it uses to shade the map by clicking on the "settings" gear in the upper right corner. See the list of districts on the left? Look at District 3, and you immediately see a "-11,016." District 6, meanwhile, has a "2,205" next to it.
Those refer to population figures. By law, each legislative district has to be of a roughly equal population. Every 10 years, a new census measures how many people live in each area. Divide the state's new population by 49 districts, and each district should have about 157,251 people in it.
But population growth hasn't been even: While the core of Spokane grew a fair amount in the past decade, the West Plains area — where District 6 is located — added a lot more people. And Seattle? Right now, District 43, in the Green Lake neighborhood near the Woodland Park Zoo has a surplus of more than 22,000 people.
In other words, even before you want to try anything fancy in Spokane County, the boundaries of District 3 had to grow, and the boundaries of District 6 had to shrink. And you've got to do that in 47 other districts. It quickly becomes something like a Rubik's Cube: Shift the borders in one district and risk messing up the rest. Go ahead. Try it. Make a copy of the map, and then use the toolbar at the top to start recoloring precincts or even individual blocks. Tag your design on Twitter with #InlanderRedistrictingMap and we'll respond with withering criticism about how you need to #DoBetter.
Of course, balancing the population isn't your only job. Your districts have to be compact — no meandering salamanders or emanating penumbras. They have to be contiguous — no putting a chunk of District 6 over in the Olympic rainforest and the rest near Spokane.
Whenever possible, they should follow existing voter precincts, natural boundaries and city and county boundaries. You're supposed to keep "communities of interest" — groups of individuals with similar concerns — together where possible. Oh, and you can't use redistricting to favor or discriminate against one political party or politician or another.
Finally, Washington state is one of only three states in the nation that make ensuring "political competition" an explicit part of their redistricting process.
But all of these competing duties tend to contradict the others: Focus on keeping communities of interest together, and you often make districts less competitive.
A few hours into simply trying to bring the populations roughly into alignment, we began to start contemplating doing crazy things like splitting Othello between three different districts. It's the only way!
And few hours after that, it was like the map began talking to us, whispering dark and terrifying secrets.


That's a lot worse for Democrats than it makes it look. Remember: Biden won by 3.4 percent this year, but the closest Democrat in the 6th District still lost by around 4 points. A district that Trump won by around 3 points or more is nearly completely out of contention for the average legislative Democrat.
This map by Republican Paul Graves doesn't make things any easier:

Oddly, it's only Republican Joe Fain's map that keeps the 6th theoretically competitive for the Democrats.

The 6th is, arguably, evidence that both sides of the redistricting battle aren't totally full of it when they say that they have values in mind other than politics. The Republicans say that they're about trying to preserve competitive districts, and you see that in Fain's map.
The Democrats say they're focused on keeping communities of interest together, and you see that in their maps.
Or, is it just that it's really hard to make the 6th a Democratic district? That's Washington State Republican Party Chairman Caleb Heimlich's argument.
"Given the way the 3rd has to grow, there's pretty much no way that you could draw the 6th to try to gerrymander it for the Democrats to pass the smell test," Heimlich says. "Given the demographics in the city of Spokane... just what you would have to do to load Democratic voters into that is just too much even for them."
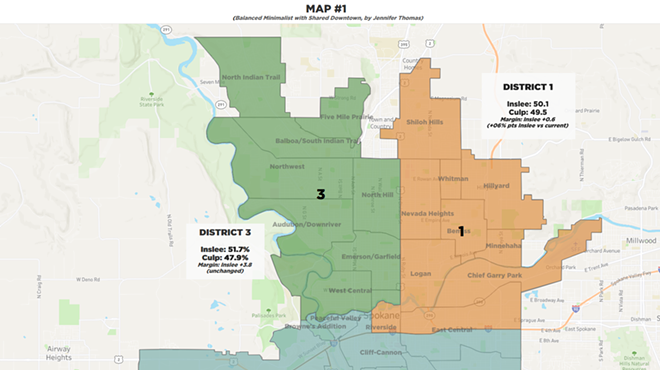
So let's test that. We drew this map, which, on first blush, doesn't look crazy:
So let's test that. We drew this map, which, on first blush, doesn't look crazy:

It looks just as compact as the original map, and it does a good job of keeping (most) communities of interest together. But while the 6th suddenly looks pretty good for Democrats under this map, the 3rd looks like a spot where Republicans have a shot at taking down Democratic incumbents like Sen. Andy Billig.
But there is a map where Democrats could hold easily both districts. But there's only one way. Go full gerrymander, drawing a map that looks like a pirohuetting ballerina:

If you want to make your own map, consider starting off of one of these as a template. Hit the paintbrush at the top and you'll be able to make your own map.
LEGISLATIVE DISTRICT MAPS
April Sims (House Democrats) Brady Walkinshaw (Senate Democrats)
CONGRESSIONAL DISTRICT MAPS
April Sims (House Democrats)
Paul Graves (House Republicans)
Joe Fain (Senate Republicans)
Help I'm Trapped in a Redistricting App