
Saturday, February 16, 2013
Where voters turned out for the Special Election
Despite the latest round of campaign signs that popped up around town, many registered voters didn’t bother filling out and submitting their ballots for the special election in Spokane County last Tuesday.
Of all eligible voters in Spokane County, just 35 percent submitted a ballot. That compares to 80 percent in last November’s general election, though no special election in the past two years has topped 50 percent.
Not all areas had equal turnout. These maps show how turnout varied among the voting precincts, ranging from 17 percent to 55 percent. (Turnout is a percentage of registered voters, so these don’t take into account the number of people who haven’t registered to vote, or can’t.)
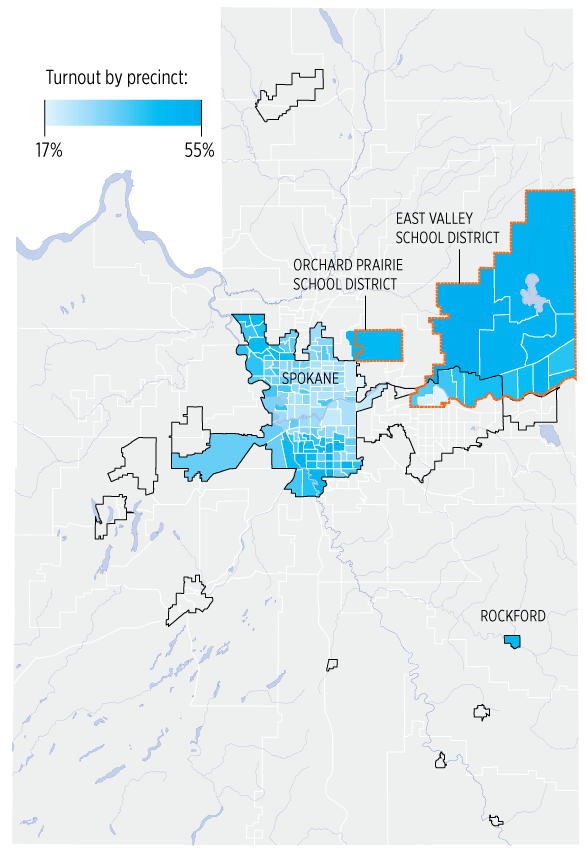
Turnout was highest in the precincts that make up East Valley School District, despite school leaders’ hopes that the school bond there would not attract much attention. That area also encompasses the Fire District 13, which had the reauthorization of an emergency medical services levy on the ballot.
Other individual precincts with levies on the ballot — a schools levy for Orchard Prairie School District and a law enforcement services levy in Rockford — had similar turnout just under 50 percent.
The City of Spokane had three issues on the ballot, and turnout varied widely within the city. Turnout was highest on the South Hill and, to the north, in Indian Trail.


Global Food & Art Market @ The Gathering House
Tuesdays, 3:30-7:30 p.m. Continues through July 29
About The Author